Just like the flash cards of our youth, infographics make it much easier to digest, understand and remember information, whether we’re talking multiplication tables or architectural styles. From fun images that break down famous architects’ signature styles into recognizable icons to charts of the world’s tallest buildings, these 15 infographics condense interesting facts about architecture into highly engaging visual learning tools. Click the images to view full-size.
Architecture Icons
(image via: archdaily)
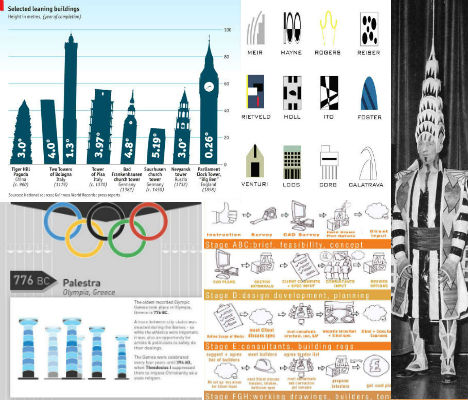
Notable architects of the 20th and 21st centuries including Santiago Calatrava, Frank Lloyd Wright, Tadao Ando, Rem Koolhaas and Zaha Hadid get the graphic treatment in this All Nighter Original poster. The infographic breaks down each architect’s most notable works into graphic icons, like Foster + Partners’ 30 St. Mary Axe tower (‘The Gherkin’).
The Architecture of Inception
(images via: fast co design)
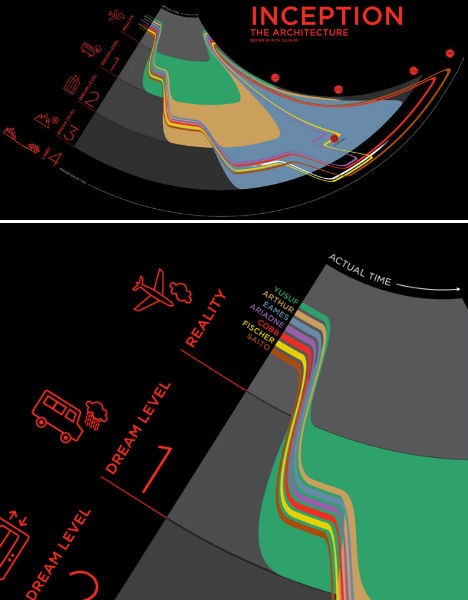
There are three types of architecture in the Martin Scorcese film Inception: real-world architecture, the intricately designed architecture created for the dream worlds, and the structure of the film’s plot throughout those dream worlds. This infographic, by graphic designer Rick Slusher, deals with the third. The many layers of plot throughout each ‘level’ of the dream world is laid out here in a way that is easier to understand than the movie itself.
Inside the Mind of an Architect by Raynes Architecture
(image via: raynes architecture)
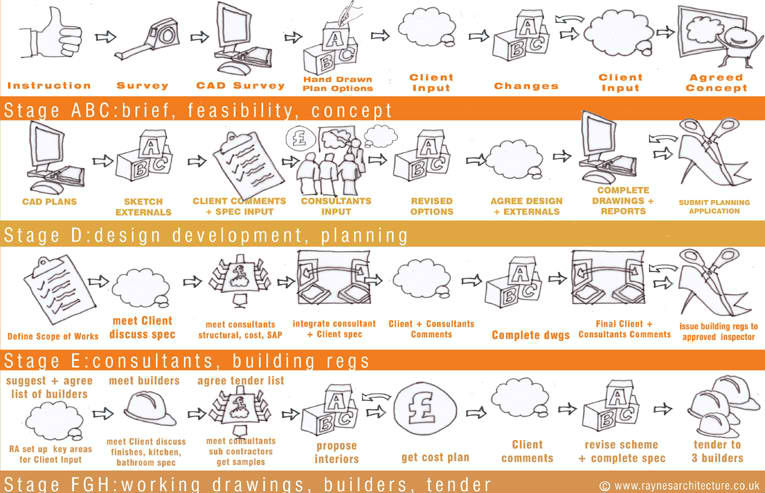
Ever wonder how an architect comes up with a plan for a building, step-by-step? Raynes Architecture lays it out in this infographic, from their first surveys to handing the completed project over to a builder.
The World’s Tallest Buildings by 2020
(image via: ctbuh.org)
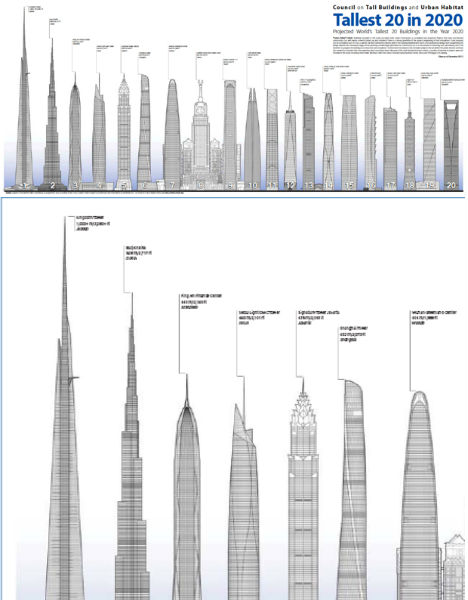
The Burj Khalifa in Dubai is currently the tallest building in the world by far at 2,717 feet, the closest being the 2,165-foot Ping An Finance Center in Shenzen, China. But by 2020, another tower is set to blow it out of the water: the Kingdom Tower in Jeddah, set to reach 3,280 feet into the air. See them all in this infographic by the Council on Tall Buildings and Urban Habitat (CTBUH.)
Home Spending Projection by Canyon Design Build
(image via: canyon design build)
How is the home renovation market shaping up this year? Canyon Design Build created this infographic that tells us where homeowners plan to spend their money over the next two years, with the biggest chunk continuing to go toward kitchens.
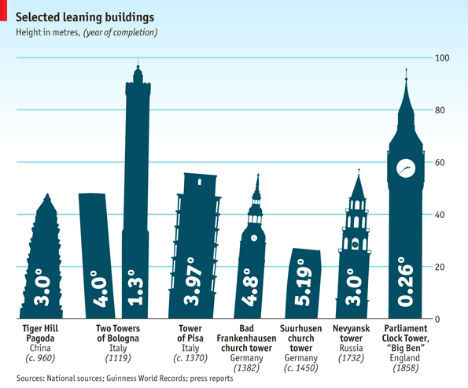
Tilted Wonders of the World
(image via: the economist)
Compare the precarious angles of the world’s most notable leaning buildings in this infographic from the Economist. While the Leaning Tower of Pisa is the most famous of them all, Germany’s Bad Frankenhausen Tower and one of the Two Towers of Bologna are actually more in danger of toppling.
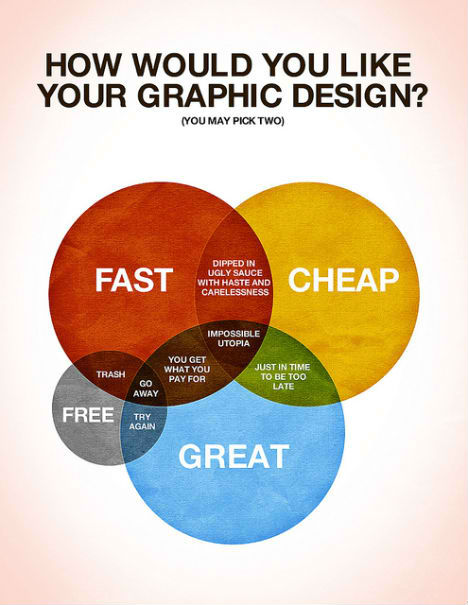
Fast, Cheap or Great: Pick Two
(image via: colin harman)
This infographic about graphic design, created by Colin Harman, is just as applicable to architecture. So you’d like your project to be fast, cheap (or free) and great? Pick any two.
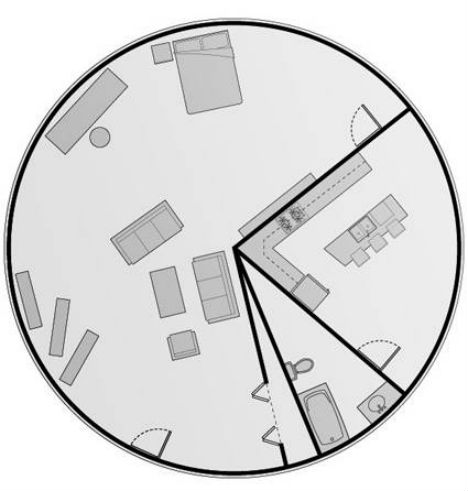
Pie Plan by Abi Huynh
(image via: abi huynh)
Designer Abi Huynh created this pie graph, which breaks down interior spaces according to how much they’re actually utilized.
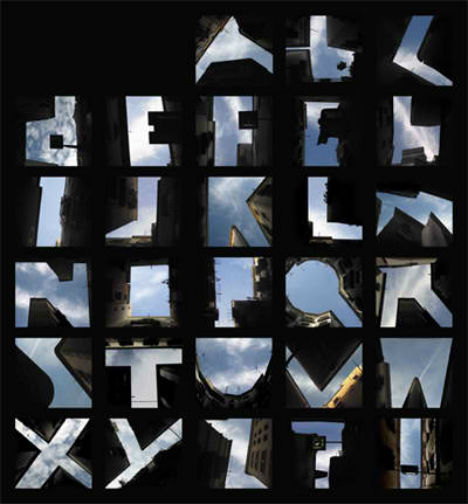
Building Alphabet
(image via: jpg mag)
This graphic brings together photographs taken from street level looking up at the tops of buildings, capturing the letters of the alphabet. Says creator Lisa Reinermann, “Standing in something like a little courtyard in Barcelona I looked up. I saw houses, the sky, clouds and a “Q”. The negative space in-between the houses formed a letter. I loved the idea of the sky as words, the negative being the positive. If I could find a “Q” other letters should be somewhere around the corner. The following weeks, I kept running around looking up to the sky. Bit by bit I found all the letters of the alphabet.”
Architecture Flash Cards
(image via: coffee with an architect)
Brush up on the various styles of architecture with humorous flash cards made by Coffee with an Architect, including Beaux Arts, Tudor, Jacobean, Vernacular and Minimalism. See them all here.
One World Trade Center
(image via: the guardian)
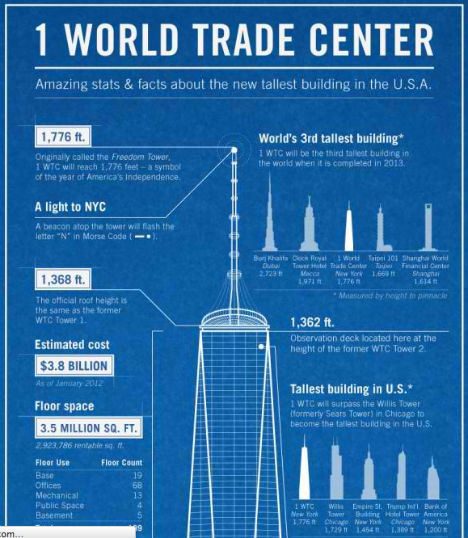
The facts about One World Trade Center, the new trade center building set to become America’s tallest structure, are all laid out in this infographic created by Online-Architecture-Degree.com. The building will be 1,776 feet tall, in honor of the year of America’s Independence.
Infographic Resume by Dustin Thorlakson
(image via: dustin thorlakson)
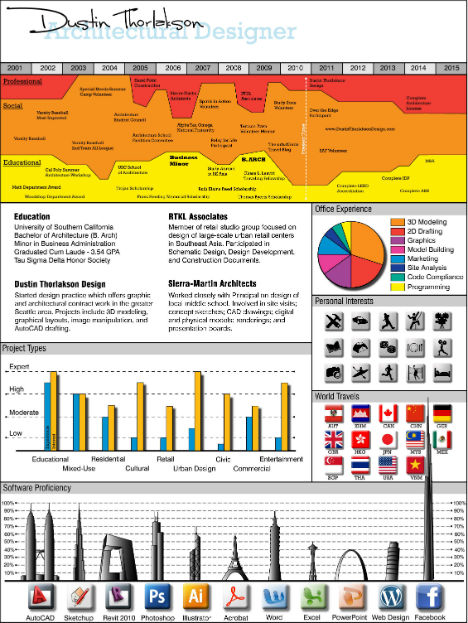
Architectural designer Dustin Thorlakson presents his resume in infographic form, making it easy to get a sense of his past experience at a glance.
The Impact of Steel in Architecture
(images via: archdaily)
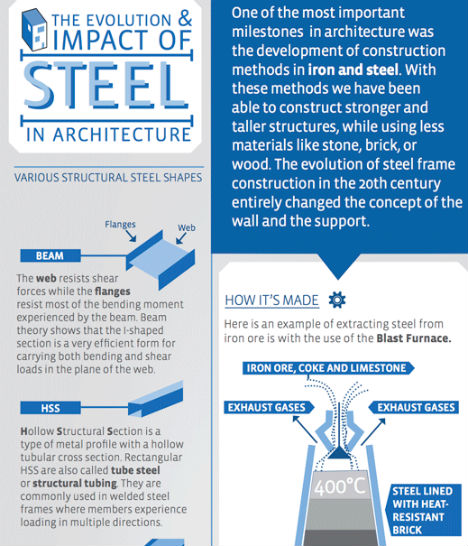
The development of construction methods utilizing steel has made a huge impact on architecture. Just how much of an impact? This infographic by Megan Jett of ArchDaily examines the types of steel used, how it’s made, and a timeline of its history.
Iconic Olympic Buildings
(images via: archdaily)
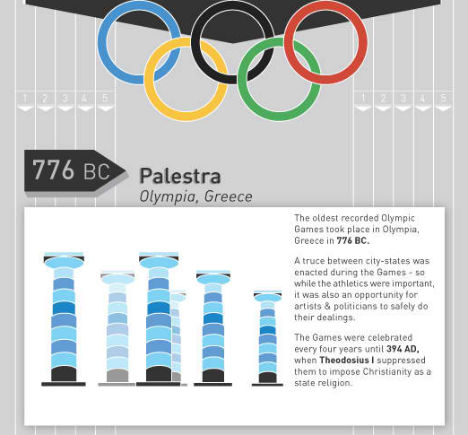
ArchDaily offers an updated infographic of the most iconic buildings of the Olympic Games from 776 B.C. all the way through 2012.
Famous Architects Dressed as their Buildings
(image via: retronaut)
Retronaut dug up this awesome photo of famous architects literally dressed as their buildings in what could almost be described as a living infographic.
