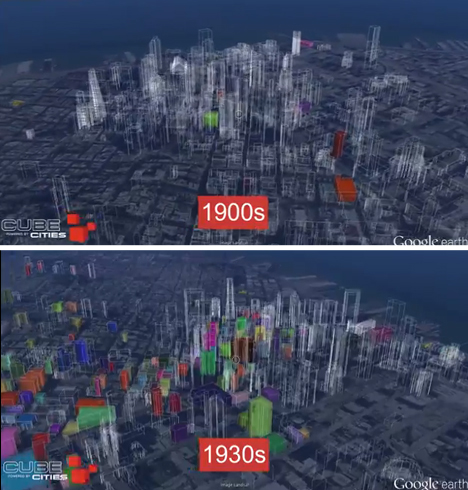
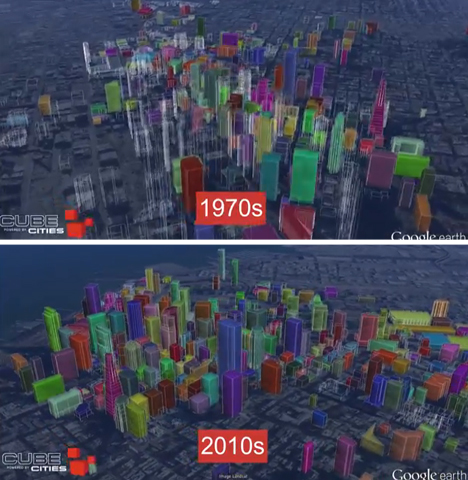
San Francisco’s timeline starts in 1877, while Toronto’s starts in 1845 and Chicago’s 1862. The buildings are color-coded according to their use, with green representing residences, blue offices and purple hotels. See all the animations at the Cube Cities YouTube channel.