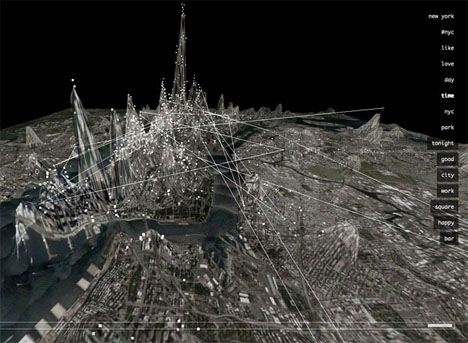
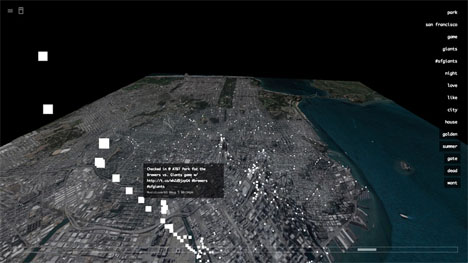
What would it look like if you could actually see all of the tweets and Instagram photos from a Beyonce concert in New York City hovering above the skyline in physical form? A project called ‘Invisible Cities’ answers that question with an interactive map that displays geocoded activity from various online services in real time with individual nodes appearing anytime a message or image is posted.

Using a Leap Motion controller and various hand gestures, the user navigates a three-dimensional data landscape, with all of that information literally at their fingertips. As data is aggregated, the landscape of the city changes, with new hills and valleys representing areas where social networking is the most and least active.
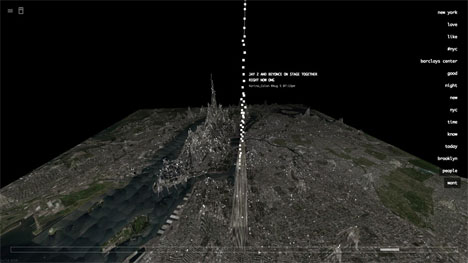
The individual nodes seen on the maps are connected by narrative threads based on themes emerging from the information as it comes streaming in. So, those tweets from the Beyonce concert look a bit like a stream of smoke rising out of Barclays Center in Brooklyn as users exclaim, “Jay Z and Beyonce on stage together right now OMG!”
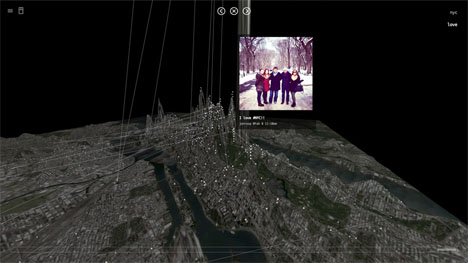
Take a look through Central Park and you’ll see Instagram posts of people running, walking their dogs or having a picnic. Version 1.0 is now available for the Leap Motion Controller and can be downloaded for free on Airspace. The creators, Christian Marc Schmidt and Liangjie Xia, say “Through an immersive, three-dimensional information landscape, the piece creates a parallel experience to the physical environment, one of intersections, discovery, and memory.”